THE KITCHEN TRIANGLE

The kitchen triangle or kitchen work triangle is a simple rule of thumb useful in kitchen design, first developed by ergonomists in the mid 20th century, who wanted a way of measuring and maximising efficiency of movement (and thus minimising space and thus cost) between the three main centres or ‘stations’ of activity in the kitchen: food storage (the fridge and pantry), food preparation (the sink) and food cooking (the stove/oven). Generally the sink, the most used part of the kitchen, should be in the centre of the arrangement, i.e. between the other two stations. The idea is that if you draw a triangle with one of these three stations at each of its three corners, then the total length of the sides of the triangle should be between four to six metres (some sources cite five to seven metres or other figures). At any rate, anything less than the lower figure probably means your kitchen will be too cramped; and anything higher might suggest that your kitchen is probably going to be too large and you will be spending too much time and effort walking between the three stations.

The kitchen triangle is also useful in making sure that no pedestrian traffic crosses any part of the working space of the kitchen- people going through the kitchen to bedrooms, laundry, etc. should not have to cross paths with or dance around a person using the kitchen. Also, the lines of movement and sight between stations should ideally not be ‘broken up’ with tall cabinets, wall ovens, and the like- there should be open countertop between each station.

As a general rule of thumb, the kitchen triangle is still a valid way of evaluating the basic functionality of your kitchen, even seventy odd years after the concept was first introduced. Of course, each design situation and brief is unique, the kitchen triangle is not appropriate for all kitchens, and these days things like kitchen islands can complicate matters- next week we will look at some of these factors in more detail.


KON WASUJIRO AND FUDO

Kon Wajiro (1888 – 1973) was a Japanese architectural scholar and folklorist who pioneered the sociological field of what he called ‘modernology’ – the study of how people and their environments change and adapt in response to the processes of modernisation. 

Kon was already well established in his study of rural farmhouses and folklore by the 1920s; his research into their urban equivalents was spurred by the Great Kanto earthquake of 1923, which laid bare the lives of Tokyoites in a very literal way and allowed him to observe how they lived and sheltered themselves among the ruins. 

Kon often made use of the term fudo (風土) in his writings, which literally translated means “wind and earth” but is usually defined as something like ‘the natural conditions and social customs of a place’.  Kon took the term to encompass the totality of the ‘folk environment’- not just conditions and customs of a particular human environment, but also the physical objects: the clothes, tools, utensils, furniture, and so on.  He regarded the house, its occupants, and its objects, contained by the house and used by the occupants, as parts of a single holistic system in which all these elements interacted.  

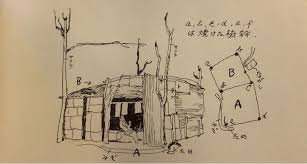
Kon would probably be less well-known today were it not for the thousands of charming drawings and diagrams he produced over the course of his career, examples of which I have included below.


DOUBLE GLAZING DEBUNKED, PART THREE

Last week’s post ended with the assertion that ‘when it comes to insulation, the best window is no window at all.’ I didn’t mean to suggest that we should forego windows entirely in our houses - of course, habitable rooms need windows, and they are a regulatory requirement. But this is a false binary. What I meant is that windows can and should be consciously sized so as to achieve the best trade-off between light and heat. I put this in italics because the question ‘How much of the wall needs to be window?’ should always be asked, but more often than not isn’t; and the calculation itself is almost never made. Instead, ‘go big and go double glazed’ is the default mantra. Here I would like to demonstrate, via a calculated example, the effect window size can have on the overall rate of heat transfer of the wall it sits in, and the room it serves.

For our example, imagine a room that’s 3m square (room area 9m2) with a 2.4m ceiling. Only one wall is an external wall (with a total area of 3m x 2.4m = 7.2m²), and it contains one window. Assume that the outside temperature is 5°C and the indoor temperature 25°C, for a difference of 20°C.

Next let’s establish a single-paned and double-paned window option for the room. I looked on the WERS website and chose a manufacturer (Capral) at random, then took the worst-performing of each of their aluminium framed fixed single and double-glazed windows: 6mm clear single glazed with a U-value of 6.3, and 6mm clear/12mm air gap/6mm clear double glazed with a U-value of 3.4. Remember that the R-value is the reciprocal of the U-value, so to obtain the R-value simply divide the U-value into 1. So for the single glazed window, 1/6.3 = R0.16; for the double glazed window, 1/3.4 = R0.29.

Given these values, the single glazed window is transferring heat at the rate of 20°C/R0.16 = 125W/ m²; the double glazed window, 20°C/R0.29 = 69W/m².

Let’s also assume that our windows are 1.5 metre wide by 1.5 metres high, i.e. 2.25m² in area. So the total heat transfer of the single glazed window is 125W/m² x 2.25m² = 281.25W, and that of the double glazed window is 69W/ m² 2.25m² = 155.25W.

What area would we need to reduce the single-glazed window to in order to reduce its total heat transfer to that of the double glazed window, i.e. 155.25W? The answer is obtained by 155.25W/125W/m² = 1.24m², for example a window roughly 0.9m x 1.4m. For a 9m² room, this window clears the minimum natural lighting required by the Building Code of Australia, being 10% of the room area, or in this case 0.9m².

In our example using the windows given, it can be seen that reducing a window’s size by around 45% has the same effect as double glazing it. A shortcut way of calculating this equivalence is to simply take the difference between the two U values (6.3 - 3.4 = 2.9) and dividing the single glazed U-value (3.4) into this (2.9/3.4 x 100 = around 45%).

Note that this example hasn’t taken into account the effect of the increase in area of the wall that accompanies the reduction in window size, because for any reasonably-well insulated wall, the effect is negligible in comparison to the effect of the change in window area. But the calculation is worth doing anyway, if only to demonstrate just how terrible the insulative performance of even double glazed windows are when compared to even a moderately insulated wall!

For a 2.25m² double glazed window, there is 7.2m² - 2.25m² = 4.95m² of wall area. Assume a wall with an R value of 4.0, which transfers heat at a rate of 20°C/R4.0 = 5W/ m². The total heat transfer of the wall is 5W/ m² x 4.95m² = 24.75m². Add to this the 155.25W total heat transfer of the window, and we obtain a figure of 180W for the wall and double glazed window together. For the single-glazed example, we have 7.2m² - 1.24m² = 5.96m² of wall area, for 5W/ m² x 5.96m² = 29.80m². Add to this the 155.25W total heat transfer of the window, and we obtain a figure of 185.05W for the wall and glazed window together.

In conclusion, I hope that this and the previous two posts in this series have been persuasive in making the case that double-glazing shouldn’t necessarily be an automatic choice, and that its advantages should be weighed against other considerations such as cost, lifespan, and a more realistic appraisal of the need for natural light; also, I hope I have demonstrated that single-glazing is by no means obsolete but is very much still a viable option in many, and perhaps even most, cases.


DOUBLE GLAZING DEBUNKED, PART TWO

In last week’s post, I made the case that insulated glazing units (double glazed windows being their most common form) are neither green nor even particularly effective.

In next week’s post, I hope to back up these claims with a concrete example; first, however, a short digression is required here into how the insulative properties of building materials and elements are measured.

The basic measure of a material’s ability to transfer heat from one side of itself to the other is called its thermal conductivity, defined as the rate of heat flow through one unit thickness of a material subject to a temperature gradient. The unit of thermal conductivity is W/ m⋅K, watts per metres kelvin, or W/ m⋅°C, watts per metres Celsius. For example, the thermal conductivity of concrete is given as around 1.30 W/ m⋅°C. From this basic figure, the heat transfer coefficient of a particular material for any particular thickness can be calculated by dividing the thickness of the material (in metres) by its thermal conductivity, then multiplying this figure by the temperature differential across the material. In practical terms, this means that a 0.2m thick solid concrete wall with a temperature gradient of 20°C (e.g. the temperature on one side of the wall is 10°C and the temperature on the other is 30°C) transfers heat from one side of itself to the other at the rate of (0.2m / 1.30W/ m⋅°C) x 20°C = 3.08 W/ m2⋅°C.

Since most building elements today are not monolithic but composites of cladding, timber, insulation, plasterboard, and so on, the insulative performance of a of a complete building assembly like a wall, floor, or roof is determined by adding together the individual heat transfer coefficients of each material, plus coefficients of surface thermal resistance at the external and internal air boundaries; this figure represents the thermal resistivity of the assembly, also known as the R-value (°C⋅m2/W). The overall heat transfer coefficient, or U-value (W/m2°⋅C), is simply the reciprocal of the R-value, i.e. it can be obtained by dividing the R-value into 1, just as the R-value can be obtained by dividing the U-value into 1. Thus the higher the R value, the better the insulative properties of the element; the lower the U-value, the better the insulative properties of the element.

The R-value tells you how many watts (joules per second) of heat you can expect to transfer across one square metre of a given building element for any given temperature difference across the element. For example, say you have a simple one-room cubic building, without openings, whose walls, floor and roof all have an R-value of 4.0. The outside temperature is 5°C and the inside temperature is 25°C. That means you have . Rearranging the equation 20°C⋅m2/W = R4.0 to 20°C⋅m2/R4.0 = W gives us a value of 20/4 = 5W per m2. Meaning we are losing 5 watts of heat from the inside to the outside for each square metre of wall/floor/roof. Suppose the building is 5m long by 5m wide by 3m high, giving a total surface area of 110m2. 5w/m2 x 110m2 = 550 Watts, meaning that to maintain the 25°C temperature in the room you would need to run a 550w heater.

Whereas the insulative ability of solid building elements such as walls and floors is usually indicated by an R-value, that of windows, in contrast, is given by a U-value. The reason R-value is not used for windows is that while R-values for well-insulated walls might be as high as 8 or more, the typical window, at least historically, has an R-value of less than one, and these numbers are unwieldy for use in calculations. In any case, that different values are needed for measuring the insulative performance walls and windows should serve to remind us of the fact that even the best double glazed window is a poorer insulator than a minimally insulated stud wall. In other words, when it comes to insulation, the best window is no window at all. A bold statement, perhaps, but one I will support with a calculated example next week.